Do you know your numbers?
I love numbers. You know what I love more? Watching people use them incorrectly. Ok, ok, I don’t really love that, but I’m always amused by how numbers can be used misleadingly or inappropriately to tell a story that’s not really there. I used to be in the geography field, and there’s a wonderful book called How to Lie With Maps that illustrates this very same concept.
The October home sale numbers just came out by the Honolulu Board of Realtors. And while the overall message is promising, it’s important to tease out the important data from the statistical noise. For example, the post states that the Ewa and Kapolei area rose 30% from last year (October 2012 vs. October 2011). The rise was specifically the number of recorded sales, from 35 to 46.
So last month there were 11 more recorded sales in that entire region compared to the same month a year before. I’m admittedly not breaking out my statistical z-score formulas right now as it’s now 6:00am and I’ve been up for 2 hours as I’m fighting jet lag having just come home from Thanksgiving in Philadelphia, but that increase of 11 sales, while encouraging, doesn’t seem to be too much beyond statistical noise (random fluctuations). However, it is encouraging.
The flip side? Median prices declined by 4 percent (itself potentially just noise). So what’s more telling to you – more sales or a dropping price point? It’s not a rhetorical question – you likely have different needs or intentions as they relate to real estate and will, therefore, be influenced by different criteria than your neighbors. I’m just illustrating some of the challenges in making sense of data instead of just taking the spin. We gotta be analytical. Take it all in but focus on the numbers that relate more to your objectives, even if they’re counter to current sentiment.
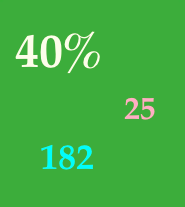
Let’s bounce over to the windward side where in Kailua and Waimanalo, sales rose 85% from 13 to 24. That’s a large percentage increase and is likely indicative of true market uptick, but it’s such a small sample set that you have to at least curb your enthusiasm somewhat. The number to latch onto more is that that the median price for single family homes rose 40%. Even with a small set of only 24, that’s a substantial increase.
Now the report doesn’t mention if distressed properties (short sales and REOs) are included, but I’m assuming they’ve been weeded out. If not, then it’s a giant asterisk of Mark McGwire proportions (baseball fans know what I mean).
I agree that October appears to be a good month and concur with my real estate colleagues that we seem to be entering into healthier times. I just like to be a bit conservative when looking at numbers because they can often incur emotional reaction that clouds judgment and more required analysis.
By the way – if you have a cure for jet lag, then please share below!


